Scope3 initiatives
In order to contribute to the realization of a sustainable society through the food business, the Mitsubishi Shokuhin Group has calculated the CO2 emissions of the entire supply chain (Scope 3) in addition to the CO2 emissions related to our business activities (Scope 1 and 2) to achieve carbon neutrality throughout society.
Scope1 and 2 Emissions
Our group aims to reduce CO2 emissions in Scope 1 and 2 by 60% compared to 2016.
We are working on achieving CO2 free electricity and reducing emission by updating energy-efficient facilities and equipment.
| FY 2016 (Base year) |
FY 2022 | FY 2023 | FY 2024 | FY 2030 | |
|---|---|---|---|---|---|
| GHG emissions (t-CO2e) |
90,223 | 42,778 | 42,135 | 40,318 | 36,089 |
Approach to Measuring Scope3 Emissions
(1)Scope3 Emissions Measurements Range
We think that CO2 emissions in our supply chain will have a significant impact on our business in the transition risk posed by climate change, and as a first step toward reducing CO2 emissions in the entire supply chain, we have started Scope3 visuali-zation during the 2022. First, we will conduct measurement at Mitsubishi Shokuhin on a stand-alone basis, and then gradually expand the scope to include all group companies.
(2)Scope3 Emissions Measurements Details
We aim to adopt more accurate emission factors within the measurement methods aligned with the date standard GHG Protocol to improve the data quality of GHG emissions. By advancing measurement methods sophistication, we will recalculate past measurement results in case of method revisions or date errors.
Scope3 Emissions Measurement Details and Results
(1)Scope3 Emissions Measurements Details
Scope3 measurements for our company are as follows.
| Measurements Details | |
|---|---|
| Target Year | FY2024 |
| Measuring Range | Mitsubishi Shokuhin Group (Mitsubishi Shokuhin & some consolidated subsidiary) |
| Target Category NO. | 1、2、3、4、5、6、7、8、9、12、13 |
(2)Measured Scope3Emissions
In our company, Scope 1 and 2 are 40.3 thousand t-CO2e (0.3% of the total), while Scope 3 is about 11,549 thousand t-CO2e (99.7% of the total) based on the calculation of actual results for fiscal year2024 (provisional).
Measured CO2 Emissions in Each Category (FY2024)
| Break Down of Emissions | GHG Emis-sions (t-CO2e) |
Percentage of Total (%) |
Percentage of Scope3 Composition(%) |
|
|---|---|---|---|---|
| Scope1 | 17,283 | 0.1 | - | |
| Scope2 | 23,036 | 0.2 | - | |
| Category 1 | Purchased goods and services | 10,409,826 | 89.8 | 90.1 |
| Category 2 | Capital goods | 26,249 | 0.2 | 0.2 |
| Category 3 | Fuel and energy related activities | 6,367 | 0.1 | 0.1 |
| Category 4 | Upstream transportation and distribution | 805,647 | 7.0 | 7.0 |
| Category 5 | Waste generated in opera-tions | 852 | 0.0 | 0.0 |
| Category 6 | Business travel | 2,115 | 0.0 | 0.0 |
| Category 7 | Employee commuting | 3,670 | 0.0 | 0.0 |
| Category 8 | Upstream leased assets | 24,382 | 0.2 | 0.2 |
| Category 9 | Downstream transportation and distribution | 4,772 | 0.0 | 0.0 |
| Category 10 | Processing of sold products | Non-subject | - | - |
| Category 11 | Use of sold products | Non-subject | - | - |
| Category 12 | End of life treatment of sold products | 263,598 | 2.3 | 2.3 |
| Category 13 | Downstream leased assets | 1,544 | 0.0 | 0.0 |
| Category 14 | Franchises | Non-subject | - | - |
| Category 15 | Investments | Non-subject | - | - |
| Scope3 total | 11,549,022 | 99.7 | 100.0 | |
| Total | 11,589,340 | 100.0 | - | |
Scope1~3 discharge organization ratio (%)
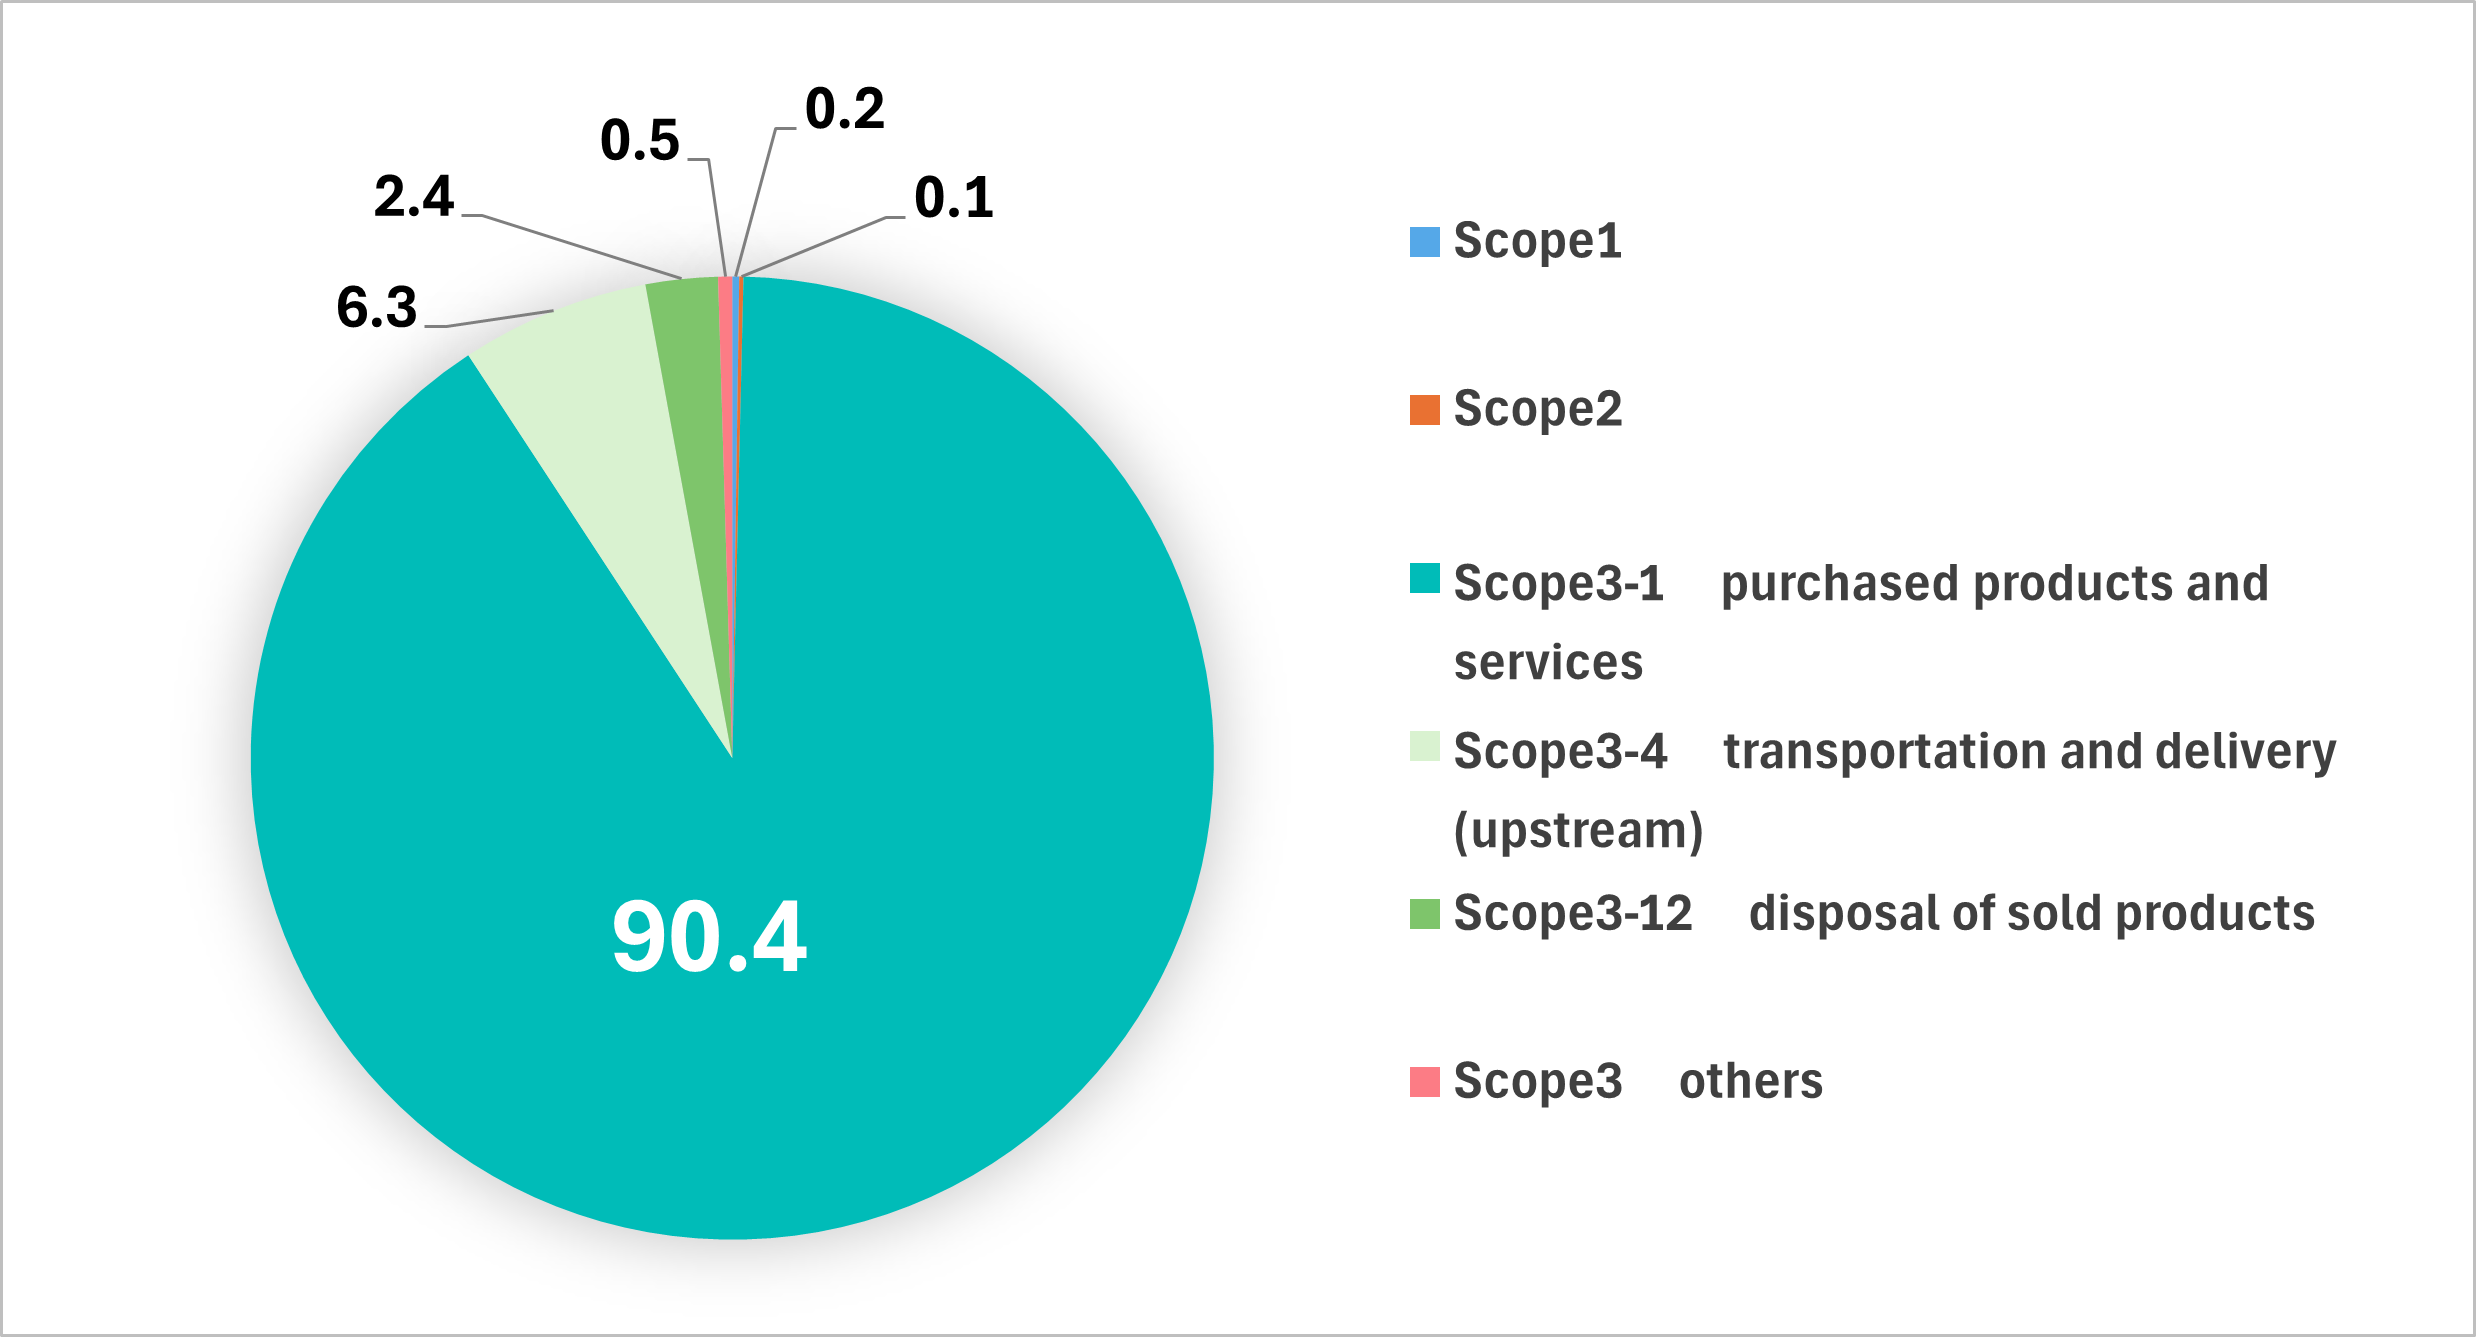
We handle a full category of products in food distribution and procure goods from many suppliers.
Therefore, out of Scope3
- Category 1 (purchased prod¬ucts and services)
- Category 4 (transportation and delivery (upstream))
- Category 12 (disposal of sold products)
accounted for 99.0% of the total for Scope 1 through 3.
Measures to Reduce GHG Emissions
Toward the achieving of carbon neutrality by 2050, we will strive to set medium-term and long-term CO2 emissions targets and implement reduction actions in cooperation with companies in our supply chain, and we will also be working on reflecting the reduction effect through the advanced measurement of Scope3.